Trading for Beginners: How to Read a Price Chart
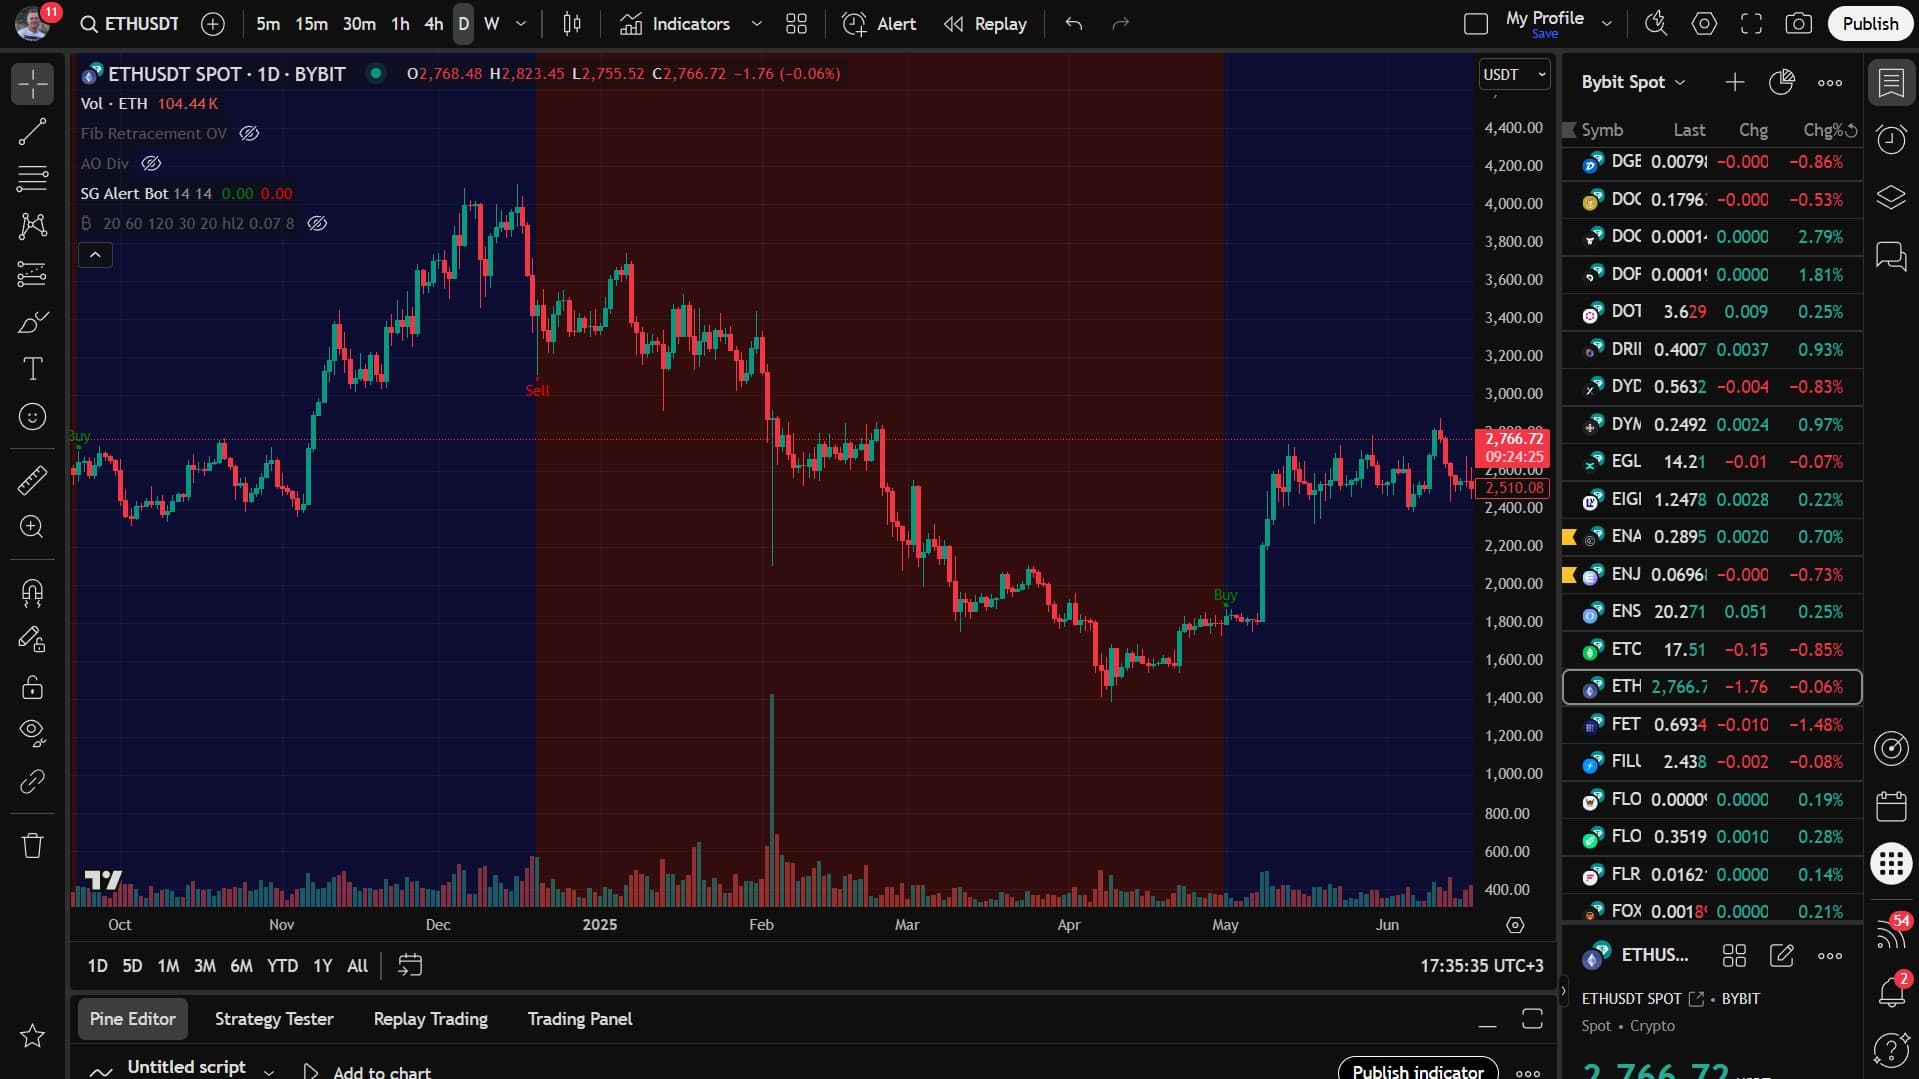
Learn price, timeframes, candles, trend, support, resistance, and volume in one practical chart-reading framework.
Free Education · Updated Weekly
James Gによるテクニカル分析ガイド、戦略、マーケット心理。
Use the free articles to learn the framework, then go deeper with the trading courses, the Elite Traders Group, or the Bitcoin Indicator Bot + Guru Bot.
📖 達人の洞察

Learn price, timeframes, candles, trend, support, resistance, and volume in one practical chart-reading framework.
記事を読むUnderstand what each order controls, what it cannot guarantee, and how execution can differ from the price you expect.
Mark support and resistance as decision zones, then use reactions, invalidation, and risk to plan a trade.
📖 達人の洞察
29 guides
Learn price, timeframes, candles, trend, support, resistance, and volume in one practical chart-reading framework.
Mark support and resistance as decision zones, then use reactions, invalidation, and risk to plan a trade.
Read higher highs, higher lows, lower highs, and lower lows to define trend and spot possible structure shifts.
Build a simple trend-following setup with market structure, pullback entries, defined stops, and planned exits.
Plan breakouts around clear levels, participation, confirmation, invalidation, and retests instead of chasing price.
Use trend context, a planned value area, confirmation, and invalidation to enter a pullback without guessing.
Recognize weak breaks, failed acceptance, fast reclaims, and poor risk locations before committing to a breakout.
Calculate trade risk, position size, R-multiples, and reward-to-risk before entry so one idea cannot control your account.
Use the 20 EMA and 50 EMA as trend context and dynamic reference areas without treating them as automatic signals.
Turn market context, setup, trigger, invalidation, size, target, and review into one repeatable pre-trade checklist.
過剰取引、復讐取引、ストップの移動、リスクの無視、ポンプの追いかけを避けてください。
エントリー、エグジット、取引ごとのリスクを定義する計画を作成し、頻度を確認します。
オンラインでの安全を確保し、資本を保護するための簡単な実践方法。
Understand what each order controls, what it cannot guarantee, and how execution can differ from the price you expect.
Understand how borrowed exposure magnifies losses, how margin calls work, and why liquidation risk must be planned before entry.
相対力指数、買われすぎ/売られすぎの状態を特定する方法、および発散取引戦略を理解します。
Plan invalidation, stop order type, position risk, and exit logic before entering a trade.
Record decisions, grade execution, and turn repeated mistakes into specific rules for the next trading session.
Test written rules on historical data, include realistic costs, and avoid mistaking a good backtest for a future guarantee.
Learn what AI trading and bots can do, where tests fail, and how to evaluate alerts, automation, permissions, and risk.
感情とルーティンをマスターして実行力を向上させましょう。
構造化された学習が時間の経過とともに結果を悪化させる理由。
トレンドフォロー、ブレイクアウト、プルバック、リスクパリティ、ジャーナリング。
Calculate the costs between a chart idea and net results, including commissions, spreads, funding, and slippage.
Learn how TTM Squeeze identifies consolidation, volatility compression, and potential breakout setups.
ヘッドアンドショルダー、ダブルトップ/ボトム、トライアングル、フラッグ、ウェッジを学び、正確な取引タイミングを実現します。
より良いトレードエントリーのために、ドージ、ハンマー、巻き込み、明けの明星、流れ星などの重要なローソク足パターンをマスターしてください。
ボリュームを使用してブレイクアウトを確認し、蓄積/分布を特定し、スマートポジショニングで誤った信号を回避します。
Learn the Stochastic indicator for momentum trading, %K and %D crossovers, and entry-signal concepts.
Best Next Step
Start with structured trading lessons, chart frameworks, and self-paced modules.
View Courses 02Join the Elite Traders Group to follow AI and human trade setups with daily market commentary.
See Elite Traders 03Use the Bitcoin Indicator Bot + Guru Bot guide when you want James' chart workflow inside TradingView after the basics.
See Bot GuideGo Deeper
The same frameworks behind these posts continue in Telegram with examples, discussion, and Q&A for the wider James G audience.