Trading for Beginners: How to Read a Price Chart
Learn price, timeframes, candles, trend, support, resistance, and volume in one practical chart-reading framework.
Free Education · Updated Weekly
来自 James G 的技术分析指南、交易策略与市场心理学。
Use the free articles to learn the framework, then go deeper with the trading courses, the Elite Traders Group, or the Bitcoin Indicator Bot + Guru Bot.
📖 大师见解

Learn price, timeframes, candles, trend, support, resistance, and volume in one practical chart-reading framework.
阅读文章Understand what each order controls, what it cannot guarantee, and how execution can differ from the price you expect.
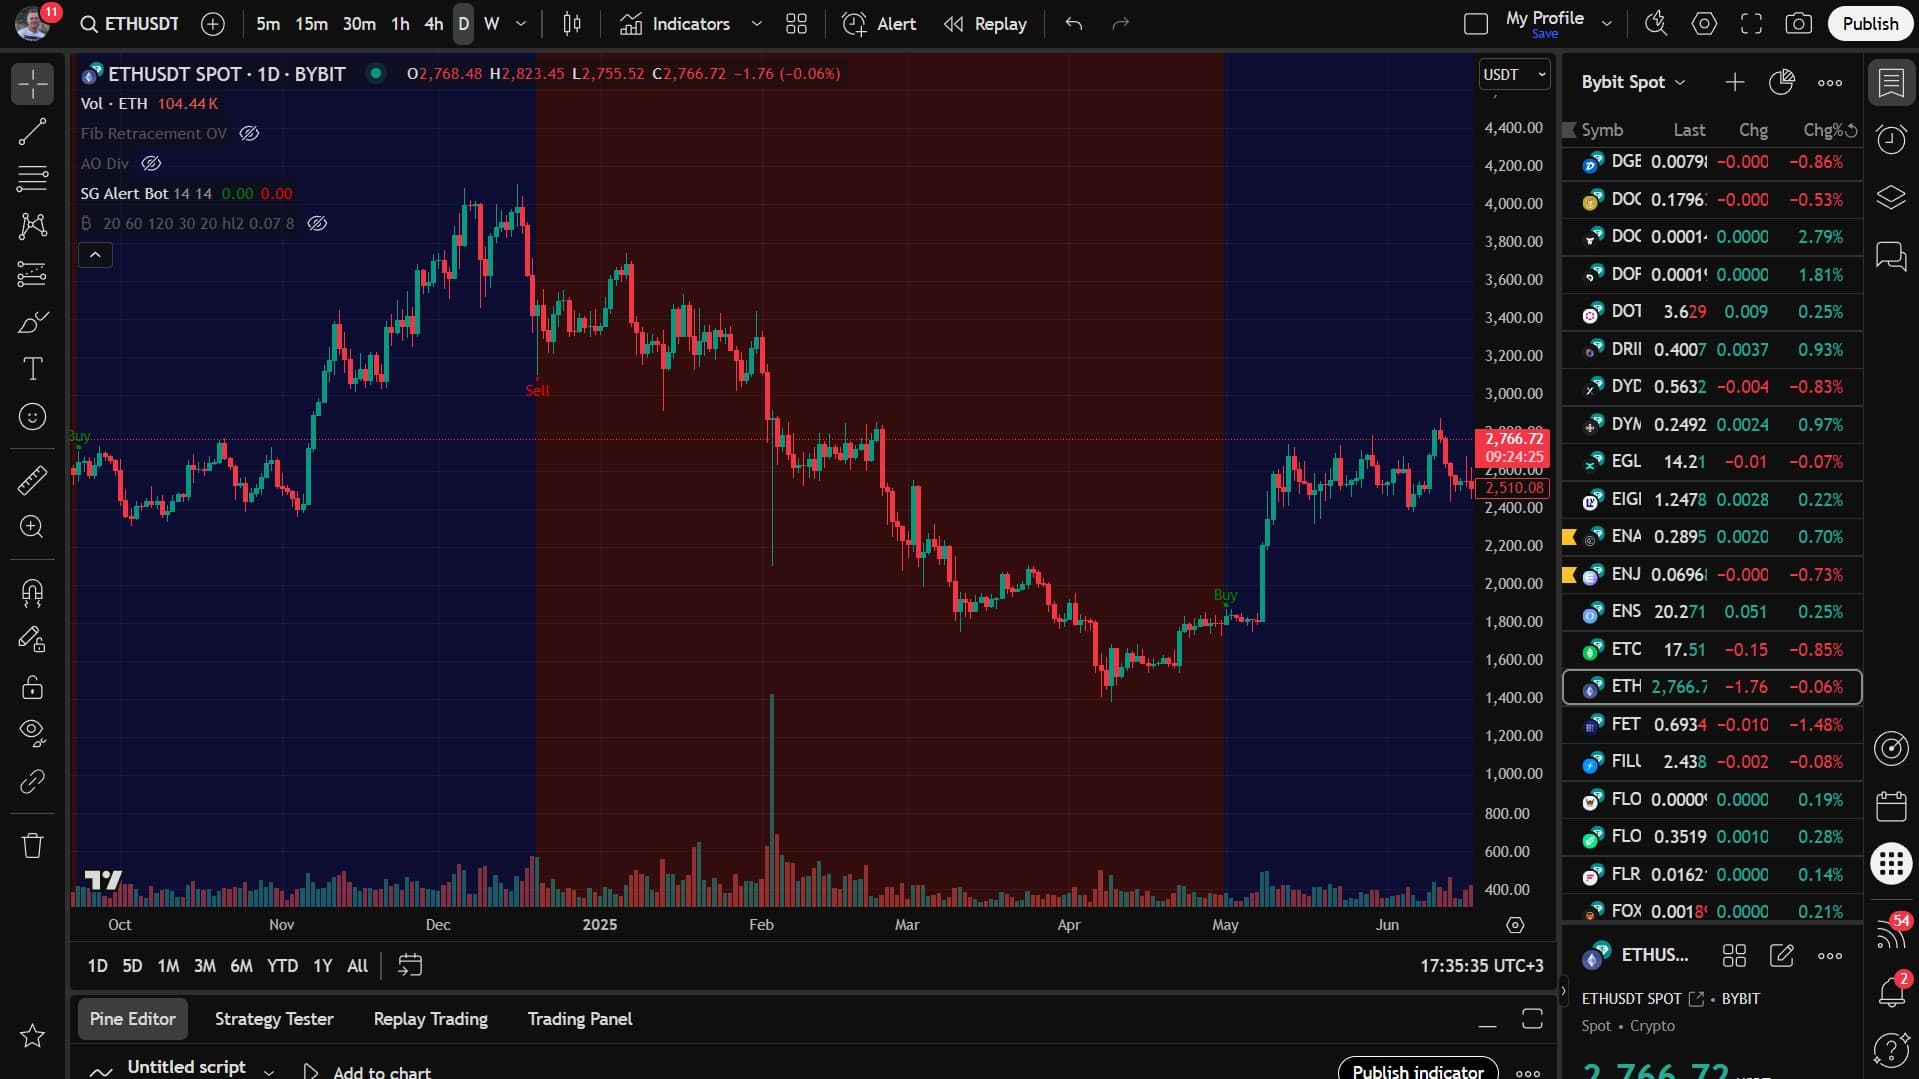
Mark support and resistance as decision zones, then use reactions, invalidation, and risk to plan a trade.
📖 大师见解
29 guides
Learn price, timeframes, candles, trend, support, resistance, and volume in one practical chart-reading framework.
Mark support and resistance as decision zones, then use reactions, invalidation, and risk to plan a trade.
Read higher highs, higher lows, lower highs, and lower lows to define trend and spot possible structure shifts.
Build a simple trend-following setup with market structure, pullback entries, defined stops, and planned exits.
Plan breakouts around clear levels, participation, confirmation, invalidation, and retests instead of chasing price.
Use trend context, a planned value area, confirmation, and invalidation to enter a pullback without guessing.
Recognize weak breaks, failed acceptance, fast reclaims, and poor risk locations before committing to a breakout.
Calculate trade risk, position size, R-multiples, and reward-to-risk before entry so one idea cannot control your account.
Use the 20 EMA and 50 EMA as trend context and dynamic reference areas without treating them as automatic signals.
Turn market context, setup, trigger, invalidation, size, target, and review into one repeatable pre-trade checklist.
避免过度交易、报复性交易、移动止损、忽视风险和追逐暴涨。
制定一个计划,定义进入、退出、每笔交易的风险和审查节奏。
确保在线安全并保护您的资金的简单做法。
Understand what each order controls, what it cannot guarantee, and how execution can differ from the price you expect.
Understand how borrowed exposure magnifies losses, how margin calls work, and why liquidation risk must be planned before entry.
了解相对强弱指数、如何发现超买/超卖状况以及背离交易策略。
Plan invalidation, stop order type, position risk, and exit logic before entering a trade.
Record decisions, grade execution, and turn repeated mistakes into specific rules for the next trading session.
Test written rules on historical data, include realistic costs, and avoid mistaking a good backtest for a future guarantee.
Learn what AI trading and bots can do, where tests fail, and how to evaluate alerts, automation, permissions, and risk.
掌握情绪和日常习惯以提高执行力。
为什么结构化学习会随着时间的推移而使你的结果变得更加复杂。
趋势跟踪、突破、回调、风险平价和日记。
Calculate the costs between a chart idea and net results, including commissions, spreads, funding, and slippage.
利用成交量来确认突破、现货吸筹/派发,并通过智能定位避免虚假信号。
掌握基本的烛台形态:十字星、锤子形、吞没形、晨星形和流星形,以获得更好的交易入场机会。
Learn how TTM Squeeze identifies consolidation, volatility compression, and potential breakout setups.
了解头肩形、双顶/双底、三角形、旗形和楔形,以实现精确的交易时机。
Learn the Stochastic indicator for momentum trading, %K and %D crossovers, and entry-signal concepts.
Best Next Step
Start with structured trading lessons, chart frameworks, and self-paced modules.
View Courses 02Join the Elite Traders Group to follow AI and human trade setups with daily market commentary.
See Elite Traders 03Use the Bitcoin Indicator Bot + Guru Bot guide when you want James' chart workflow inside TradingView after the basics.
See Bot GuideGo Deeper
The same frameworks behind these posts continue in Telegram with examples, discussion, and Q&A for the wider James G audience.