Trading for Beginners: How to Read a Price Chart
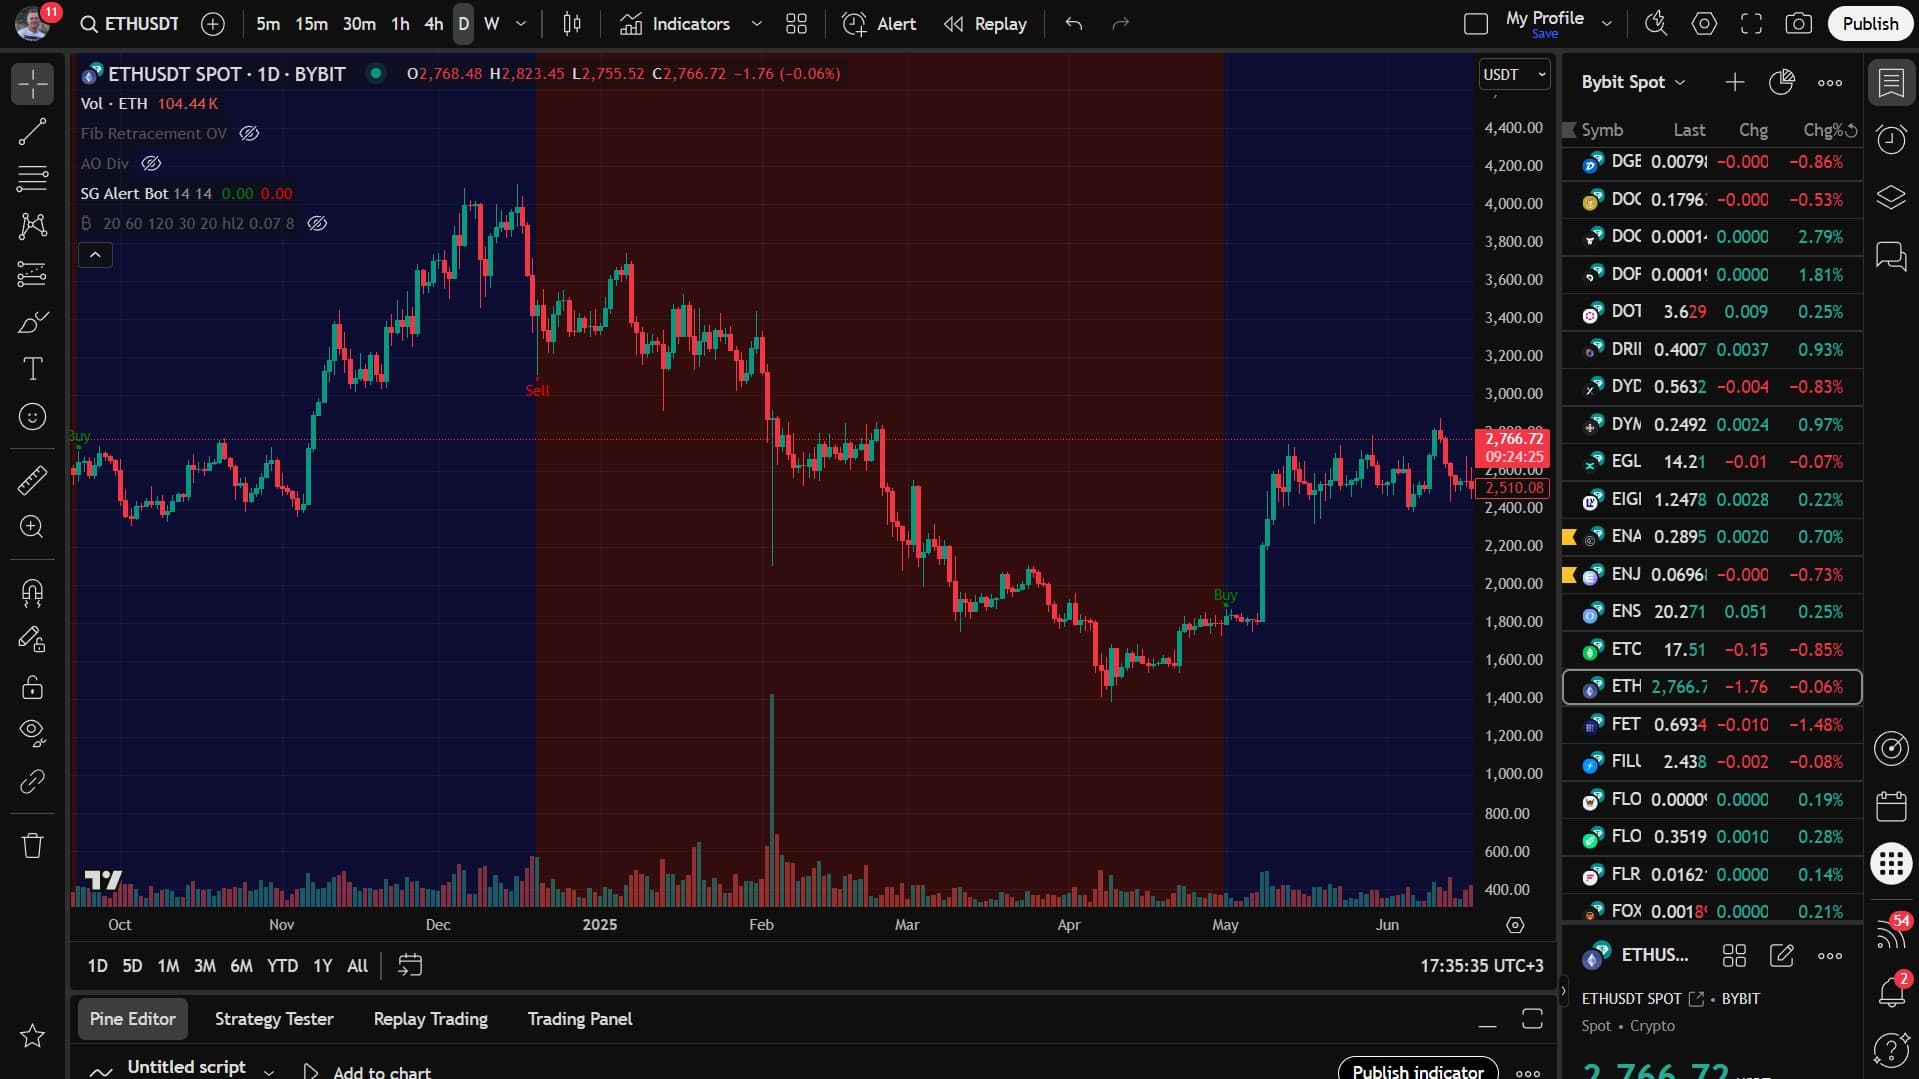
Learn price, timeframes, candles, trend, support, resistance, and volume in one practical chart-reading framework.
Free Education · Updated Weekly
Hướng dẫn phân tích kỹ thuật, chiến lược giao dịch và tâm lý thị trường từ James G.
Use the free articles to learn the framework, then go deeper with the trading courses, the Elite Traders Group, or the Bitcoin Indicator Bot + Guru Bot.
📖 Thông tin chuyên sâu của Guru

Learn price, timeframes, candles, trend, support, resistance, and volume in one practical chart-reading framework.
Đọc bàiUnderstand what each order controls, what it cannot guarantee, and how execution can differ from the price you expect.
Mark support and resistance as decision zones, then use reactions, invalidation, and risk to plan a trade.
📖 Thông tin chuyên sâu của Guru
29 guides
Learn price, timeframes, candles, trend, support, resistance, and volume in one practical chart-reading framework.
Mark support and resistance as decision zones, then use reactions, invalidation, and risk to plan a trade.
Read higher highs, higher lows, lower highs, and lower lows to define trend and spot possible structure shifts.
Build a simple trend-following setup with market structure, pullback entries, defined stops, and planned exits.
Plan breakouts around clear levels, participation, confirmation, invalidation, and retests instead of chasing price.
Use trend context, a planned value area, confirmation, and invalidation to enter a pullback without guessing.
Recognize weak breaks, failed acceptance, fast reclaims, and poor risk locations before committing to a breakout.
Calculate trade risk, position size, R-multiples, and reward-to-risk before entry so one idea cannot control your account.
Use the 20 EMA and 50 EMA as trend context and dynamic reference areas without treating them as automatic signals.
Turn market context, setup, trigger, invalidation, size, target, and review into one repeatable pre-trade checklist.
Tránh giao dịch quá mức, giao dịch trả thù, di chuyển điểm dừng, bỏ qua rủi ro và chạy theo máy bơm.
Xây dựng một kế hoạch xác định các điểm vào, điểm thoát, rủi ro trên mỗi giao dịch và nhịp độ xem xét.
Test written rules on historical data, include realistic costs, and avoid mistaking a good backtest for a future guarantee.
Learn what AI trading and bots can do, where tests fail, and how to evaluate alerts, automation, permissions, and risk.
Tìm hiểu đầu và vai, đỉnh/đáy đôi, hình tam giác, cờ và nêm để biết thời gian giao dịch chính xác.
Hiểu Chỉ số sức mạnh tương đối, cách phát hiện các điều kiện mua quá mức/bán quá mức và chiến lược giao dịch phân kỳ.
Learn the Stochastic indicator for momentum trading, %K and %D crossovers, and entry-signal concepts.
Learn how TTM Squeeze identifies consolidation, volatility compression, and potential breakout setups.
Các phương pháp đơn giản để giữ an toàn trực tuyến và bảo vệ vốn của bạn.
Nắm vững các mô hình nến thiết yếu: doji, búa, nhấn chìm, sao mai và sao băng để có điểm vào lệnh giao dịch tốt hơn.
Understand what each order controls, what it cannot guarantee, and how execution can differ from the price you expect.
Understand how borrowed exposure magnifies losses, how margin calls work, and why liquidation risk must be planned before entry.
Sử dụng âm lượng để xác nhận các đột phá, tích lũy/phân phối điểm và tránh các tín hiệu sai bằng định vị thông minh.
Plan invalidation, stop order type, position risk, and exit logic before entering a trade.
Record decisions, grade execution, and turn repeated mistakes into specific rules for the next trading session.
Làm chủ cảm xúc và thói quen để cải thiện việc thực hiện.
Tại sao việc học có cấu trúc lại tạo nên kết quả của bạn theo thời gian.
Theo dõi xu hướng, đột phá, thoái lui, cân bằng rủi ro và ghi nhật ký.
Calculate the costs between a chart idea and net results, including commissions, spreads, funding, and slippage.
Best Next Step
Start with structured trading lessons, chart frameworks, and self-paced modules.
View Courses 02Join the Elite Traders Group to follow AI and human trade setups with daily market commentary.
See Elite Traders 03Use the Bitcoin Indicator Bot + Guru Bot guide when you want James' chart workflow inside TradingView after the basics.
See Bot GuideGo Deeper
The same frameworks behind these posts continue in Telegram with examples, discussion, and Q&A for the wider James G audience.