Trading for Beginners: How to Read a Price Chart
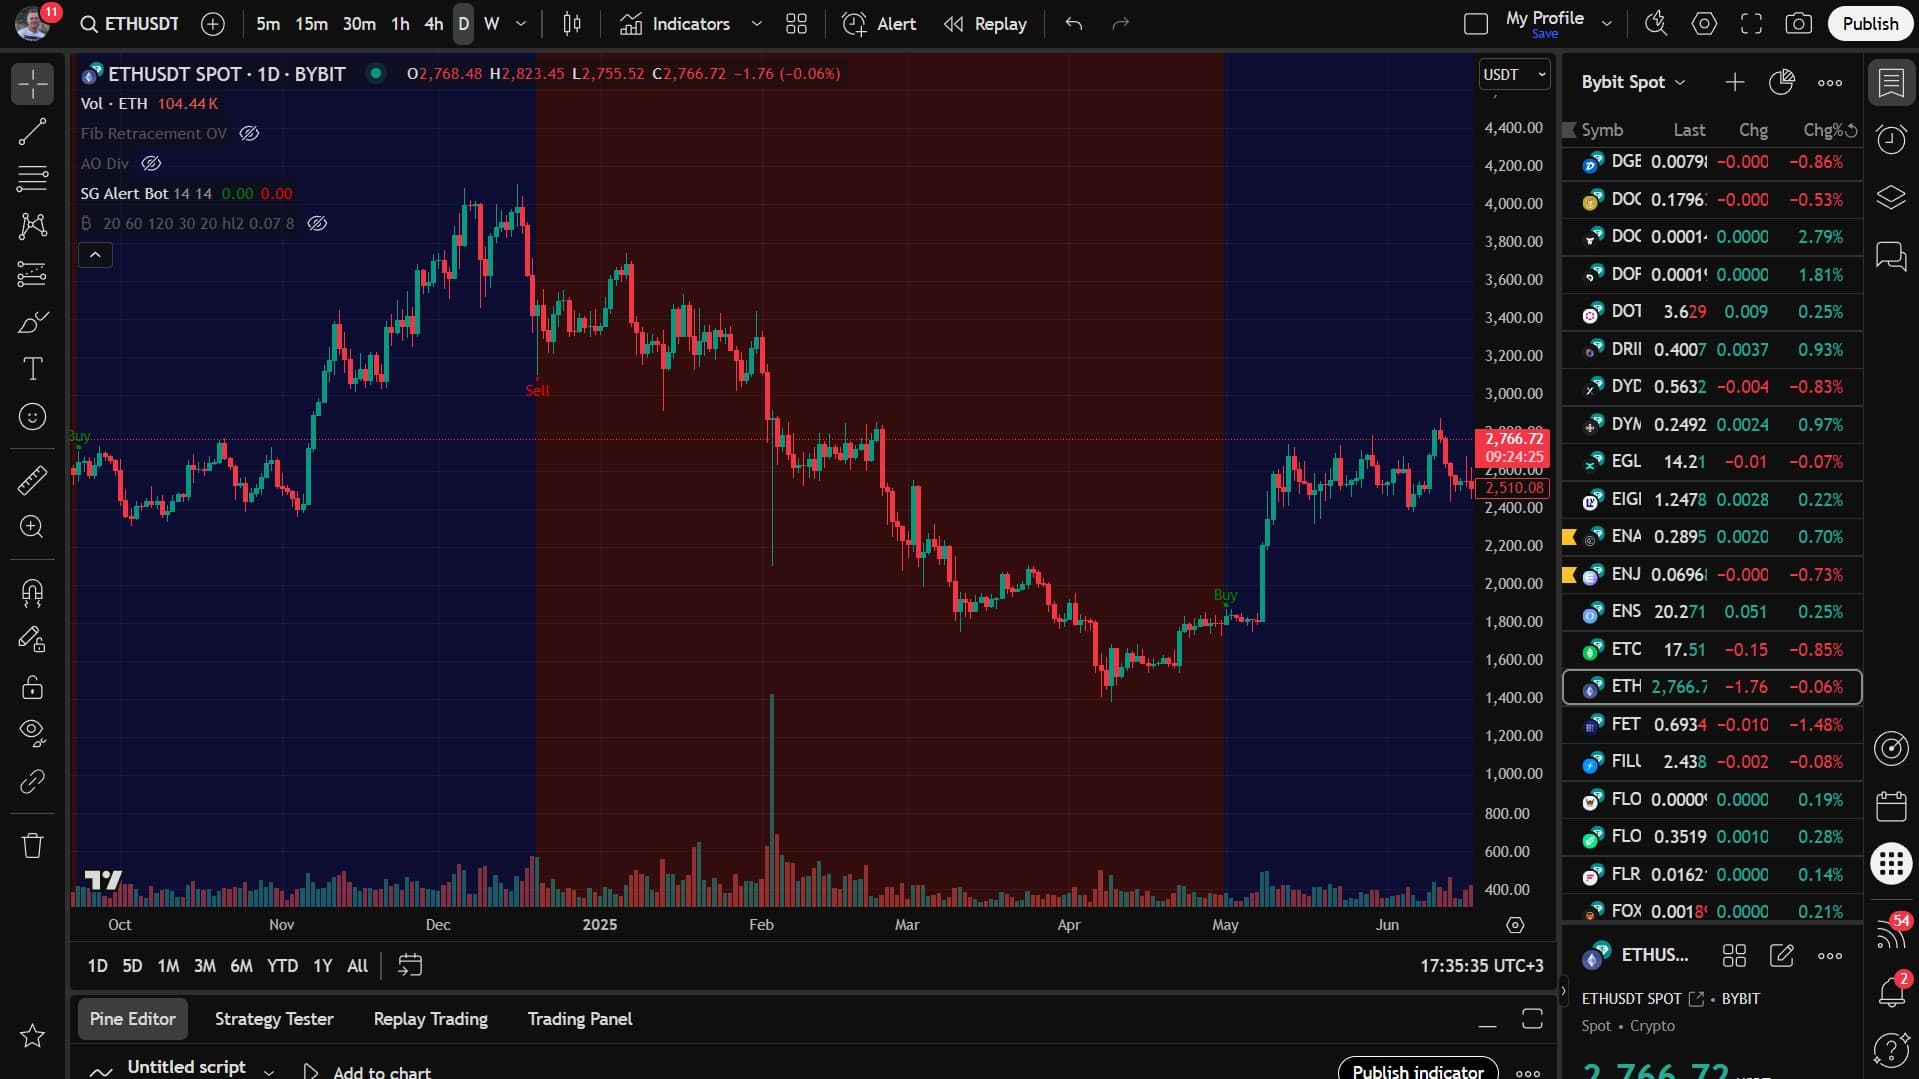
Learn price, timeframes, candles, trend, support, resistance, and volume in one practical chart-reading framework.
Free Education · Updated Weekly
Гайды по теханализу, стратегии и психология трейдинга от James G.
Use the free articles to learn the framework, then go deeper with the trading courses, the Elite Traders Group, or the Bitcoin Indicator Bot + Guru Bot.
📖 Информация от гуру

Learn price, timeframes, candles, trend, support, resistance, and volume in one practical chart-reading framework.
Читать статьюUnderstand what each order controls, what it cannot guarantee, and how execution can differ from the price you expect.
Mark support and resistance as decision zones, then use reactions, invalidation, and risk to plan a trade.
📖 Информация от гуру
29 guides
Learn price, timeframes, candles, trend, support, resistance, and volume in one practical chart-reading framework.
Mark support and resistance as decision zones, then use reactions, invalidation, and risk to plan a trade.
Read higher highs, higher lows, lower highs, and lower lows to define trend and spot possible structure shifts.
Build a simple trend-following setup with market structure, pullback entries, defined stops, and planned exits.
Plan breakouts around clear levels, participation, confirmation, invalidation, and retests instead of chasing price.
Use trend context, a planned value area, confirmation, and invalidation to enter a pullback without guessing.
Recognize weak breaks, failed acceptance, fast reclaims, and poor risk locations before committing to a breakout.
Calculate trade risk, position size, R-multiples, and reward-to-risk before entry so one idea cannot control your account.
Use the 20 EMA and 50 EMA as trend context and dynamic reference areas without treating them as automatic signals.
Turn market context, setup, trigger, invalidation, size, target, and review into one repeatable pre-trade checklist.
Избегайте чрезмерной торговли, сделок с целью мести, перемещения стопов, игнорирования риска и погони за пампами.
Создайте план, определяющий входы, выходы, риск на сделку и просматривайте периодичность.
Простые методы обеспечения безопасности в Интернете и защиты вашего капитала.
Understand what each order controls, what it cannot guarantee, and how execution can differ from the price you expect.
Understand how borrowed exposure magnifies losses, how margin calls work, and why liquidation risk must be planned before entry.
Plan invalidation, stop order type, position risk, and exit logic before entering a trade.
Record decisions, grade execution, and turn repeated mistakes into specific rules for the next trading session.
Test written rules on historical data, include realistic costs, and avoid mistaking a good backtest for a future guarantee.
Овладейте эмоциями и рутиной, чтобы улучшить исполнение.
Почему структурированное обучение со временем ухудшает ваши результаты.
Следование за трендом, прорывы, откаты, паритет рисков и ведение журнала.
Calculate the costs between a chart idea and net results, including commissions, spreads, funding, and slippage.
Learn what AI trading and bots can do, where tests fail, and how to evaluate alerts, automation, permissions, and risk.
Используйте объем для подтверждения прорывов, точечного накопления/распределения и избегайте ложных сигналов с помощью умного позиционирования.
Изучите графики «голова и плечи», двойные вершины и основания, треугольники, флаги и клинья для точного выбора времени для торговли.
Поймите индекс относительной силы, как определить условия перекупленности/перепроданности и торговые стратегии дивергенции.
Learn how TTM Squeeze identifies consolidation, volatility compression, and potential breakout setups.
Освойте основные свечные модели: доджи, молот, поглощение, утреннюю звезду и падающую звезду для более эффективных входов в сделку.
Learn the Stochastic indicator for momentum trading, %K and %D crossovers, and entry-signal concepts.
Best Next Step
Start with structured trading lessons, chart frameworks, and self-paced modules.
View Courses 02Join the Elite Traders Group to follow AI and human trade setups with daily market commentary.
See Elite Traders 03Use the Bitcoin Indicator Bot + Guru Bot guide when you want James' chart workflow inside TradingView after the basics.
See Bot GuideGo Deeper
The same frameworks behind these posts continue in Telegram with examples, discussion, and Q&A for the wider James G audience.