THE FOUNDATION
Start with the chart James uses.
Weekly, daily, four-hour and hourly context. Support and resistance, volume bars, moving-average lines and a momentum panel, used in my market-reading workflow.
JAMES G · THE CHART SETUP GUIDE
Set up your charts the way I read the markets. Follow my indicator settings, add Volume Profile and work through a clear sequence from the weekly chart to the hourly chart.
16-page PDF · English · One-time US$19
Instant PDF download after checkout. Keep it on your phone or print the worksheets.
See exactly what is inside ↓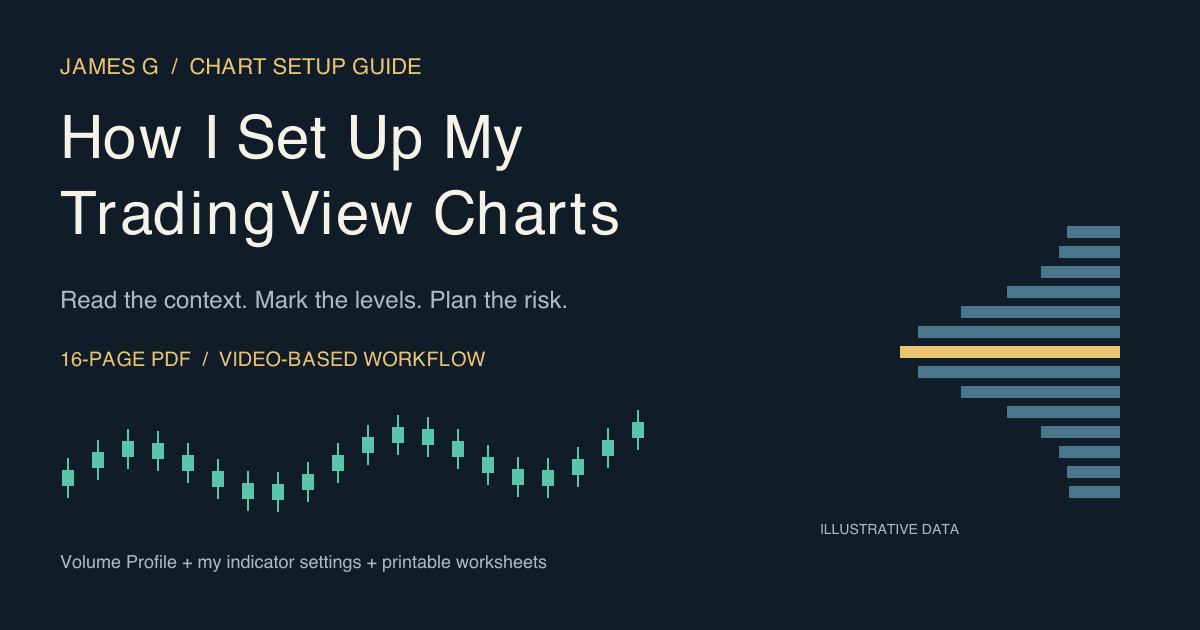
A WORKFLOW YOU CAN RECREATE
THE FOUNDATION
Weekly, daily, four-hour and hourly context. Support and resistance, volume bars, moving-average lines and a momentum panel, used in my market-reading workflow.
VOLUME PROFILE
Choose a visible or fixed range. Find the point of control, value area and volume nodes. Read the busiest price areas and map support and resistance.
OPTIONAL EXTRA
Anchor from a meaningful high, low or breakout. Compare price with the average traded price since that event, and add a clear reference to your chart.
MAKE IT REPEATABLE
Use the settings card, chart examples, risk calculation, pre-trade checklist and printable journal. Follow my indicator settings and save a layout you can use every day.
THE LAYOUT YOU WILL BUILD
I start with the wider timeframe, mark the important levels and plan the risk before focusing on the short-term chart. Recreate that sequence with standard TradingView indicators and drawing tools.
Your setup card brings the tools together: EMA 50 and 200, Stochastic RSI 14/14/3/3, a 70% Volume Profile value area and a clearly chosen VWAP anchor.
Watch the source video ↗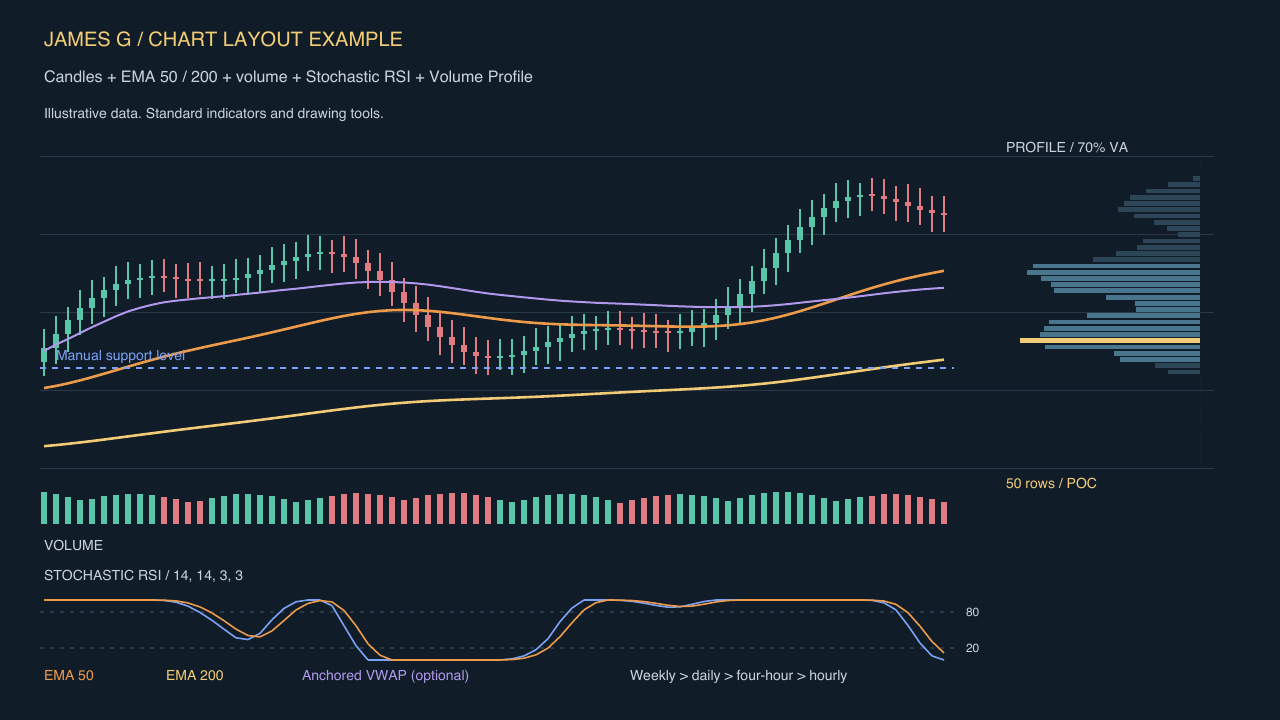 Standard-tool layout example with illustrative data.
ONE PURCHASE. A PRACTICAL REFERENCE.
Setup steps, indicator explanations, illustrated examples, a settings card, a checklist and a printable journal in one downloadable PDF.
US$19 once. No recurring subscription for this guide.
Standard TradingView tools only. Guru Bot and the licensed Bitcoin Indicator are sold separately; neither is included or needed for this setup.
Volume Profile shows historical traded volume by price. Pending displayed limit orders require an exchange order book or broker-supported Depth of Market.
The guide works with a TradingView chart and walks you through each tool by name. Volume Profile availability depends on your TradingView plan. You can build the core layout first and add the profile when available.
EMA 50 and EMA 200 with Close as the source; Stochastic RSI with 14/14/3/3 inputs and 20/80 levels; Volume Profile with a 70% value area and about 50 rows; plus an Anchored VWAP setup. The guide shows where to enter each setting.
No. This is a chart setup guide using standard TradingView indicators and drawing tools. It includes no Guru Bot access, licensed scripts, bot settings or automated signals.
After Stripe confirms payment, the return page unlocks the download. Save the PDF and bookmark that private page for repeat downloads. If you lose it, contact support with your Stripe receipt.
For a missing download, duplicate payment or product issue, contact support. See the site's terms for purchase conditions. Statutory consumer rights apply.